- 4192 Devonwood Way, Ashburn, Virginia, 20148
- Helpline: +1 (703) 665-3747
Association of Procalcitonin and the Severity of COVID-19: A Meta-Analysis
- Home
- Back to Journal
- Article Details
Abstract
Object: It is of great significance to early predict the progression towards severe or critical stages of coronavirus disease 2019 (COVID-19). Increasing studies investigated the procalcitonin (PCT) levels of the patients with COVID-19, but the results were inconsistent. Herein, the present meta-analysis aimed to evaluate the association of PCT concentrations and the severity of COVID-19.
Materials and methods: Studies recording PCT values in patients with COVID-19 were searched from PubMed, CrossRef, Web of science, CNKI and Wanfang databases online between January 2020 and April 2020. Based on a random effects model, summary standard mean differences (SMDs) and the corresponding 95% confidence intervals (95%CIs) were used to compare the PCT levels between severe and/or critical cases and non-severe cases of this illness.
Results: Totally nineteen eligible studies were included, involving 1037 severe and/or critical cases, and 1542 non-severe cases of COVID-19. The present study demonstrated that the severe and above cases had significantly increased PCT levels (SMD (95%CI): 0.77 (0.52, 1.02); z = 6.09, p<0.001) compared with non-severe cases.
Conclusion: The results indicated that the severe and/or critical cases of COVID-19 had significantly increased PCT levels than non-severe cases, which suggested that the PCT levels might be associated with the severity of COVID-19.
Keywords: Procalcitonin; Severity; Coronavirus disease 2019; COVID-19; Meta-analysis
Background
The current outbreak of coronavirus disease 2019 (COVID-19), caused by severe acute respiratory syndrome coronavirus 2 (SARS-CoV-2) [1], is a public emergency of international pandemic and a great threat for global public health [1, 2]. COVID-19 has become large burdens of morbidity and mortality for almost every country because of its characteristics of rapid transmission and spread [3, 4]. The prognosis differed among different subtypes according to the disease severity [5]. Its overall case-fatality rate was 2.08–2.3% [3, 5]. However, the critical cases had a remarkably high mortality of 49.0%, although it merely accounted for 5% of total cases [5]. Moreover, the severe cases also had higher mortality than mild cases (31.67% vs. 1.01%) [6]. Therefore, it is of great significance to early predict the progression towards severe or critical stages of this illness.
Procalcitonin (PCT), as the peptide precursor of calcitonin, is in low levels in circulation [7]. It is elevated in response to bacterial infections, and reduce rapidly during recovery [8]. Thus it is a sensitive biomarker of bacterial sepsis, and does not significantly rise in patients with merely traditional viral infections [9]. However, PCT values were reported to ascend in severe or critical cases of COVID in some studies [10–13]. Meanwhile, no statistically difference in PCT values between the severe and moderate cases [11, 12, 14, 15], or between the critical and moderate patients were also reported in some other studies [12, 15]. Herein, we conducted a meta-analysis to compare the values of PCT between severe and/or critical cases and non-severe cases of COVID-19, aiming to evaluate whether the parameter can be used to monitor the severity of COVID-19 and its deterioration.
Materials and Methods
Search Strategy
A comprehensive search was conducted from PubMed, and CNKI databases between January 2020 and April 2020 using the key words “clinical”, “laboratory”, “procalcitonin”, or “PCT”, in combination with “Coronavirus Disease 2019”, “2019 novel coronavirus”, “severe acute respiratory syndrome coronavirus 2”, “COVID-19”, “2019-nCoV”, or “SARS-CoV-2”. The references from the relevant articles and reviews were examined for potential studies.
Inclusion and exclusion criteria
The studies were included if they met the following criteria: (a) all patients with COVID-19 were confirmed based on positive result of sequencing or real-time reverse transcriptase polymerase chain reaction (RT-PCR) for viral nucleic acid test and Computed Tomography (CT) according to the Guidelines for diagnosis and management of COVID-19 issued by the National Health Commission of China (version 7) [16]; (b) laboratory features consisted of procalcitonin; (c) subtyping were performed based on the degree of severity of Covid-19.
The studies were excluded after reviewing because of one of the following reasons: (a) abstracts without full texts; (b) no subtype of Covid-19 was witnessed; (c) positive proportions of laboratory test were recorded instead of absolute value; (d) articles without available data, or duplications.
Approval from ethics committee was not required in the present study as the obtained data were from online articles.
Data Extraction
The following relevant information was extracted from included studies: first author, year of publication, country, area, subtype, sample size, percentage of male subjects, mean or median age, overall percentage of comorbidity, PCT concentrations in both severe and above groups and non-severe groups (Table 1). All the searched articles were confirmed by two independent reviewers.
Table 1: Characteristics of included studies on the association between procalcitonin and the severity of coronavirus disease 2019.
|
|
|
|
|
Severe and critical group |
Non-severe group |
||||||||||
|
Author |
Year |
Country |
Region |
Subtype |
N |
Male, % |
Age |
Comorbidity, % |
PCT (ng/mL) |
Subtype |
N |
Male, % |
Age |
Comorbidity, % |
PCT (ng/mL) |
|
Chen, G. [14] |
2020 |
China |
Wuhan |
Severe |
11 |
90.9 |
61.0 |
45.5 |
0.18±0.50* |
Moderate |
10 |
70.0 |
52.0 |
20.0 |
0.05±0.01 * |
|
Cheng, K. B. [10] |
2020 |
China |
Wuhan |
Severe |
181 |
54.7 |
54 |
50.28 |
0.07±0.09' |
Moderate |
282 |
51.2 |
49 |
40.43 |
0.05±0.04 * |
|
Gao, W. [15] |
2020 |
China |
Beijing |
Severe |
22 |
40.9 |
61.4 |
- |
0.13±0.10* |
Moderate |
55 |
45.5 |
44.2 |
- |
0.12±0.03 |
|
Gao, W. [15] |
2020 |
China |
Beijing |
Critical |
11 |
63.6 |
77.1 |
- |
0.I4±0.16* |
Moderate |
55 |
45.5 |
44.2 |
- |
0.12±0.03 |
|
Gao, Y. [18] |
2020 |
China |
Anhui |
Severe |
15 |
60.0 |
45.20 |
- |
0.04±0.05 * |
Mild |
28 |
60.7 |
42.96 |
- |
0.02±0.02 * |
|
Huang, C. L [19] |
2020 |
China |
Wuhan |
1CU group |
13 |
85 |
49.0 |
38 |
0.1 ±0.22* |
Non-ICU group |
28 |
68 |
49.0 |
29 |
0.1 |
|
Li, D. [20] |
2020 |
China |
Hunan |
Severe, critical |
17 |
70.6 |
64.0 |
- |
0.47±0.67 |
Mild, moderate |
63 |
44.4 |
43.0 |
- |
0.04 ±0.07 |
|
Li, D. [11] |
2020 |
China |
Wuhan |
Severe |
22 |
54.5 |
54.5 |
45.5 |
0.07±0.09* |
Moderate |
18 |
38.9 |
43 |
5.6 |
0.03±0.01 * |
|
Li, D. [11] |
2020 |
China |
Wuhan |
Critical |
22 |
59.1 |
68 |
81.8 |
0.41 ±0.84 * |
Moderate |
18 |
38.9 |
43 |
5.6 |
0.03±0.01 * |
|
U, H. [21] |
2020 |
China |
Wuhan |
Severe |
56 |
28.0 |
66.55 |
- |
0.14±0.353 |
Moderate |
60 |
21.2 |
57.32 |
- |
0.08±0.279 |
|
U, H. [21] |
2020 |
China |
Wuhan |
Critical |
16 |
7.5 |
64.06 |
- |
0.44±0.512 |
Moderate |
60 |
21.2 |
57.32 |
- |
0.08±0.279 |
|
Liu, S.J. [22] |
2020 |
China |
Hubei |
Severe |
97 |
48.45 |
62.0 |
62.89 |
0.26±0.21 * |
Moderate |
196 |
50.51 |
49.50 |
27.55 |
0.23±0.17* |
|
Liu,S.J. [22] |
2020 |
China |
Hubei |
Critical |
49 |
75.51 |
72 |
83.67 |
0.57±0.67* |
Moderate |
196 |
50.51 |
49.50 |
27.55 |
0.23±0.17* |
|
Song, X. [23] |
2020 |
China |
Gansu |
Severe |
9 |
66.7 |
46.29 |
- |
2.432± 1.054 |
Moderate |
19 |
57.9 |
36.62 |
- |
0.694±0.172 |
|
Tian, D. S. [24] |
2020 |
China |
Wuhan |
Severe |
286 |
54.2 |
61 |
51.0 |
0.1 ±0.148* |
Non-scvcrc |
166 |
48.2 |
53 |
33.1 |
0.05±0.044 * |
|
Wan, S. [13] |
2020 |
China |
Chongqing |
Severe |
40 |
52.5 |
56 |
70 |
0.11 ±0.059* |
Mild |
95 |
54.7 |
44 |
16.3 |
0.04±0.022 * |
|
Xiang, T.X. [25] |
2020 |
China |
Jiangxi |
Severe, critical |
9 |
88.9 |
53 |
- |
0.16±0.15 |
Moderate |
40 |
62.5 |
40.6 |
- |
0.04±0.03 |
|
Xiong, J. [12] |
2020 |
China |
Wuhan |
Severe |
21 |
- |
- |
- |
0.33±0.27 |
Mild |
18 |
- |
- |
- |
0.13±0.11 |
|
Xiong, J. [12] |
2020 |
China |
Wuhan |
Critical |
10 |
- |
- |
- |
0.38±0.31 |
Mild |
18 |
- |
- |
- |
0.13±0.11 |
|
Xiong, J. [12] |
2020 |
China |
Wuhan |
Severe |
21 |
- |
- |
- |
0.33±0.27 |
Moderate |
40 |
- |
- |
- |
0.21 ±0.20 |
|
Xiong, J. [12] |
2020 |
China |
Wuhan |
Critical |
10 |
- |
- |
- |
0.38±0.31 |
Moderate |
40 |
- |
- |
- |
0.21 ±0.20 |
|
Yuan,J. [26] |
2020 |
China |
Chongqing |
Severe, critical |
31 |
58.1 |
56.4 |
45.2 |
0.05±1.55* |
Mild, moderate |
192 |
45.3 |
44.9 |
20.8 |
0.02±0.30 * |
|
Zhang, J. J. [27] |
2020 |
China |
Wuhan |
Severe |
56 |
43.1 |
64 |
79.5 |
0.10±0.178* |
Non-scvcrc |
82 |
50.7 |
53.7 |
53.7 |
0.05±0.052 * |
|
Zhang, R. G. [28] |
2020 |
China |
Wuhan |
Spo2<90% group |
14 |
50 |
70.5 |
- |
0.13±0.015* |
Spo2*90% group |
55 |
45 |
30.0 |
- |
0.13*0.015 * |
|
Zhang, W. [29] |
2020 |
China |
Beijing |
Severe |
9 |
66.7 |
52.2 |
- |
0.1 ±0.02 |
Moderate |
56 |
46.4 |
48.2 |
- |
0.1 ±0.04 |
|
Zhang, W. [29] |
2020 |
China |
Beijing |
Critical |
9 |
33.3 |
81.2 |
- |
0.4±0.06 |
Moderate |
56 |
46.4 |
48.2 |
- |
0.1 ±0.04 |
|
Zuo, F. T. [30] |
2020 |
China |
Henan |
Severe |
11 |
- |
53.7 |
- |
0.05±0.119* |
Non-scvcrc |
39 |
- |
46.6 |
- |
0.02±0.007 * |
Statistical analysis
The Standard Mean Differences (SMDs) and the corresponding 95% confidence intervals (95%CIs) were used to compare the concentrations of PCT between severe and above cases and moderate and below cases. Homogeneity was evaluated by Q and I squared (I2) tests. Sensitivity analysis was conducted to investigate the influence of a single study on the overall effect estimate. Publication bias was estimated by Begg’s and Egger’s tests. In the present study, p-values less than 0.05 were considered of statistical significance. Statistical calculations and figures were performed by STATA version 14.0.
Results
The flow diagram of literature selection was shown in figure 1. The initial search yielded 107 potential articles. Of these studies, 63 articles (24 lacked laboratory measurements, 14 reviews, 13 no subgrouping of COVID-19 cases, 5 case reports, 4 meta-analyses, 2 with children subjects) were excluded for further screening. Then, 25 articles without absolute PCT values, and 1 study with flaw data [17] were excluded. Finally, a total of 19 studies were included into the meta-analysis [10–15, 18–30]. All the subjects of included studies were Chinese people. The mean or median ages of the patients included ranged from 53 to 81.2 years. The characteristics of included article were shown in table 1.
Data collected from 19 studies were analyzed in a random-effects model to compare the PCT values between the above two groups (Figure 2). Statistical increased PCT was witnessed in severe and critical cases compared with non-severe cases (SMD (95%CI): 0.77 (0.52, 1.02); z=6.09, p<0.001) with significant heterogeneity (Q=205.54,
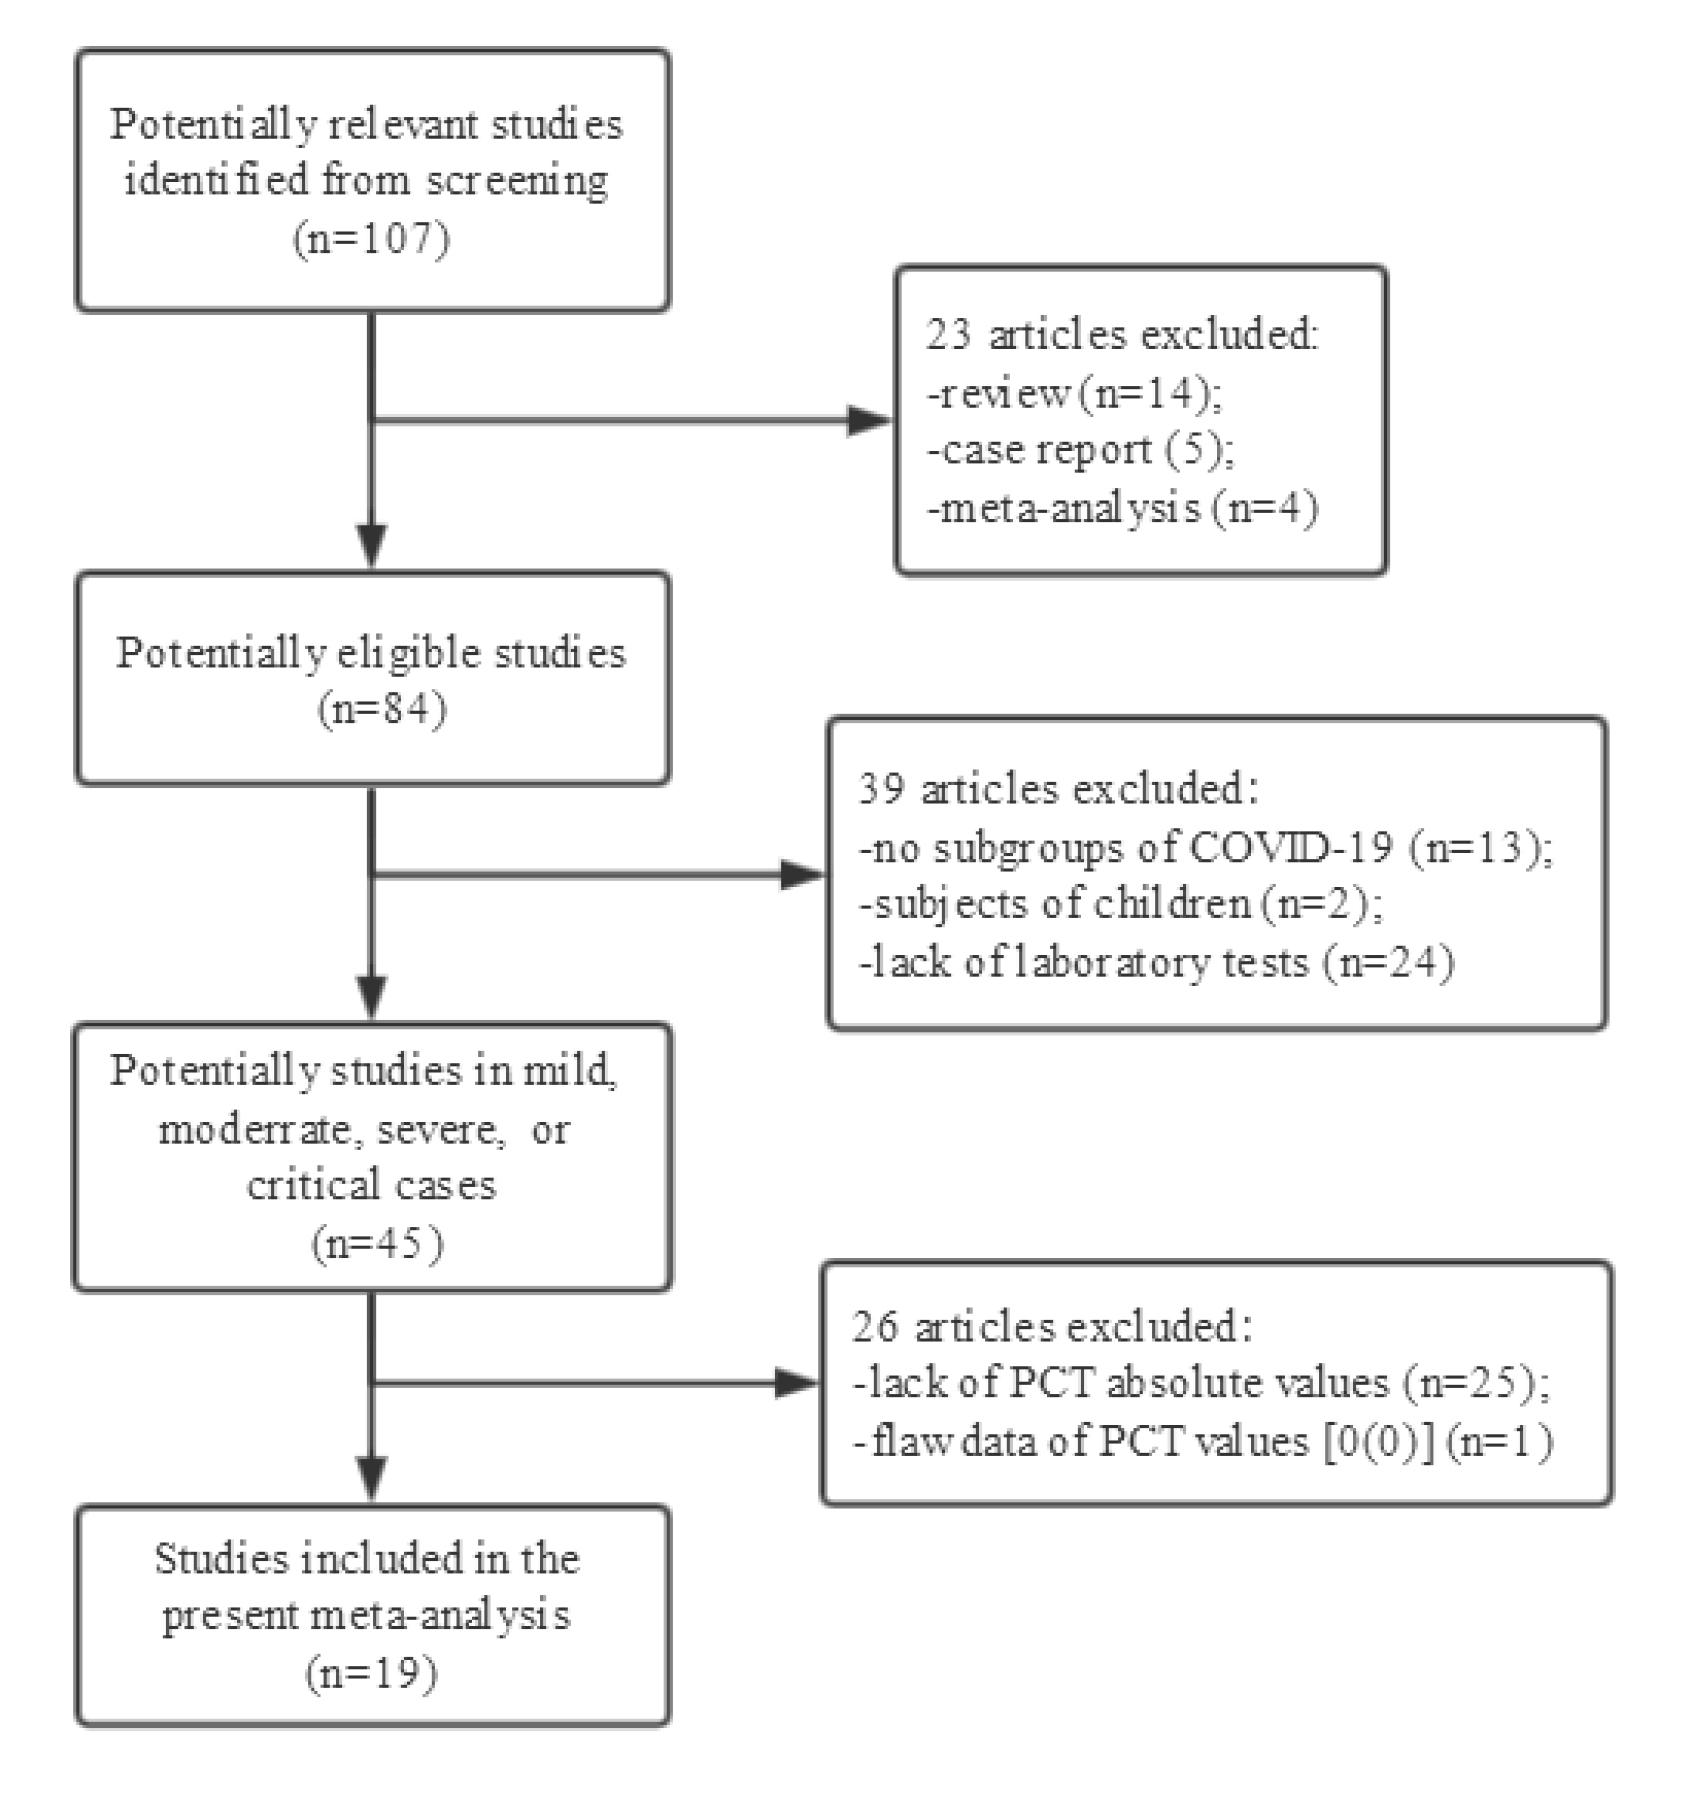
Figure 1: Flow diagram and results of the literature search.
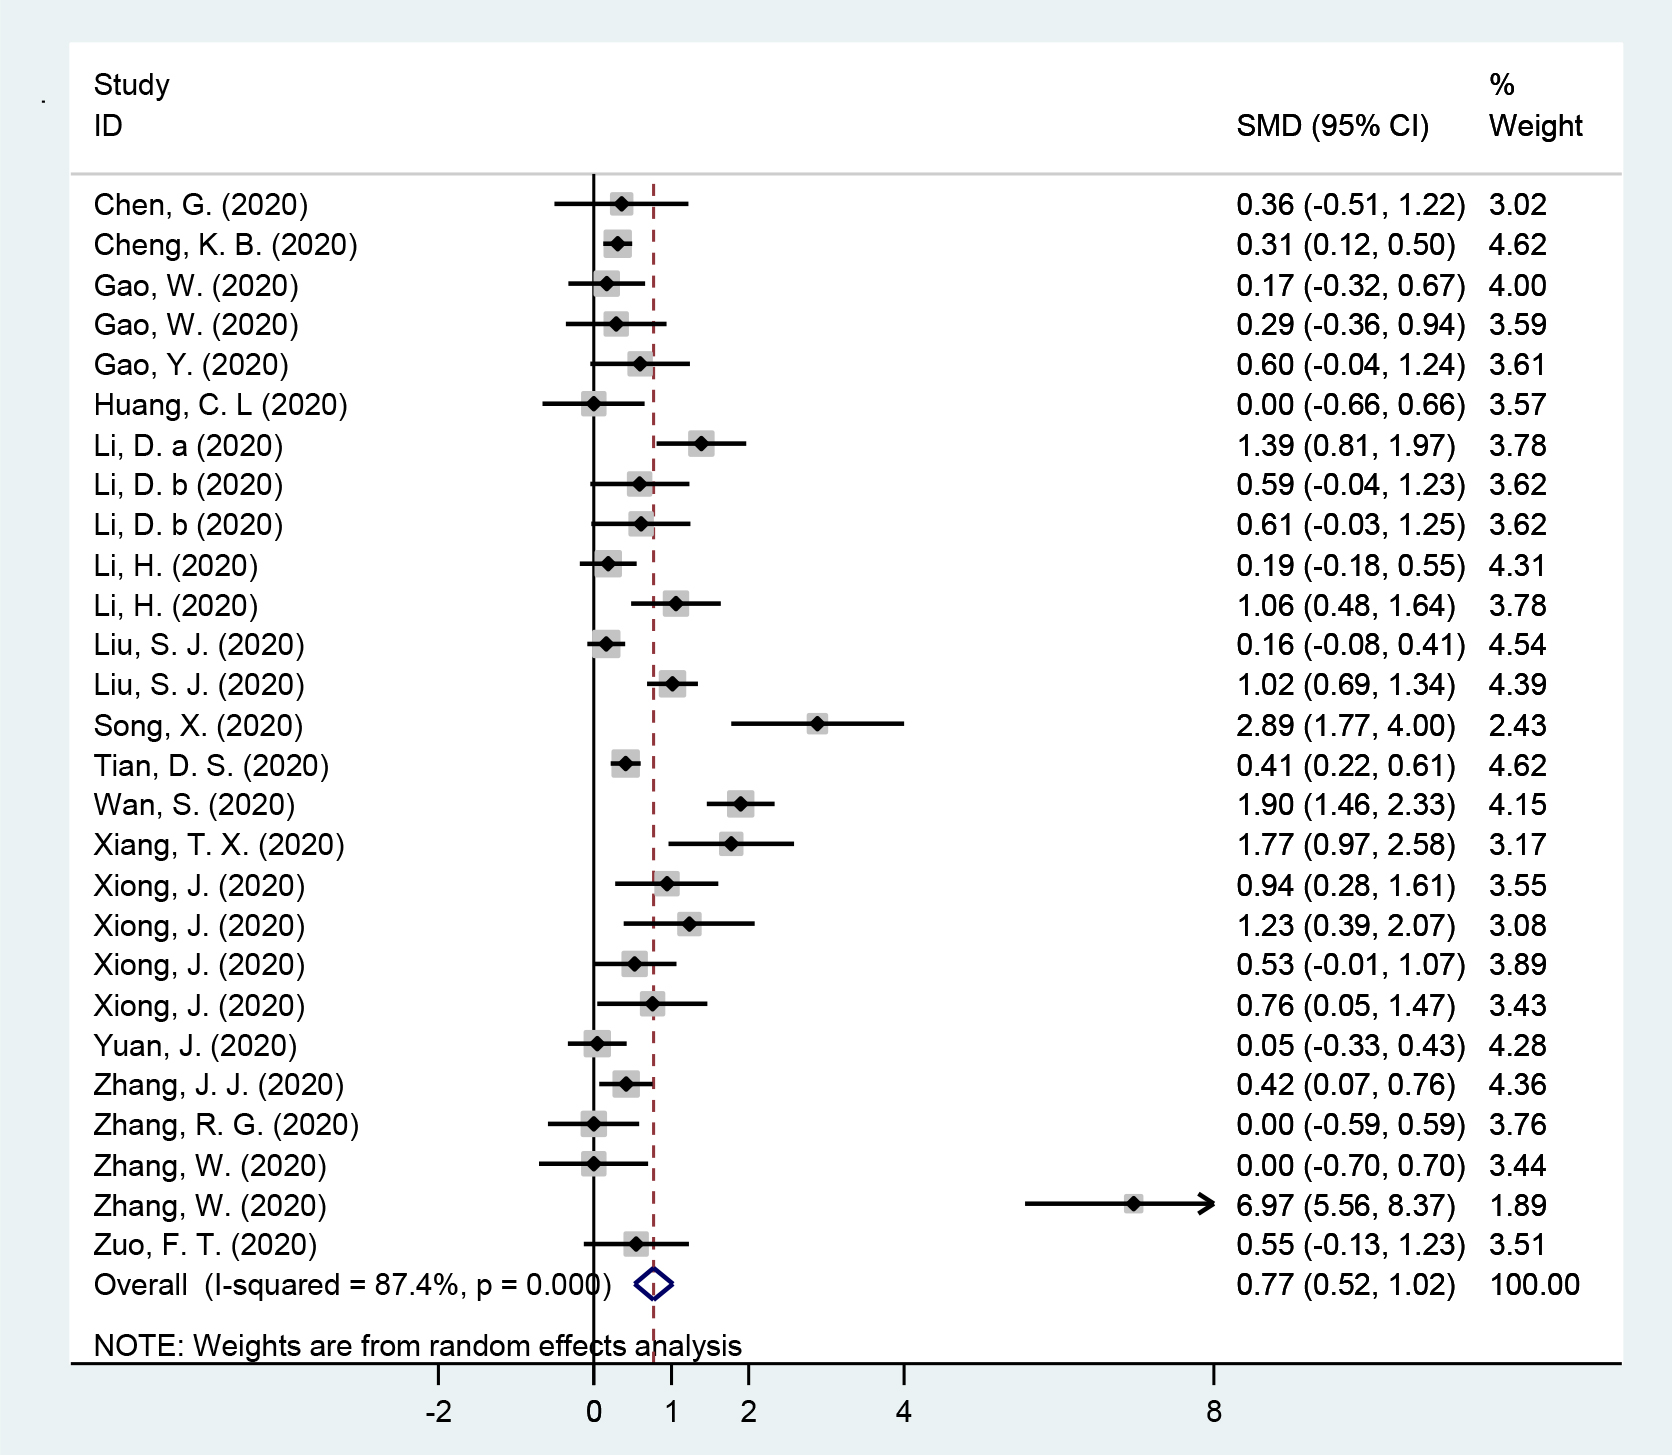
Figure 2: Forest plot of meta-analysis for the comparation between severe and critical groups and non-severe groups in subjects with coronavirus disease 2019 in included studies.
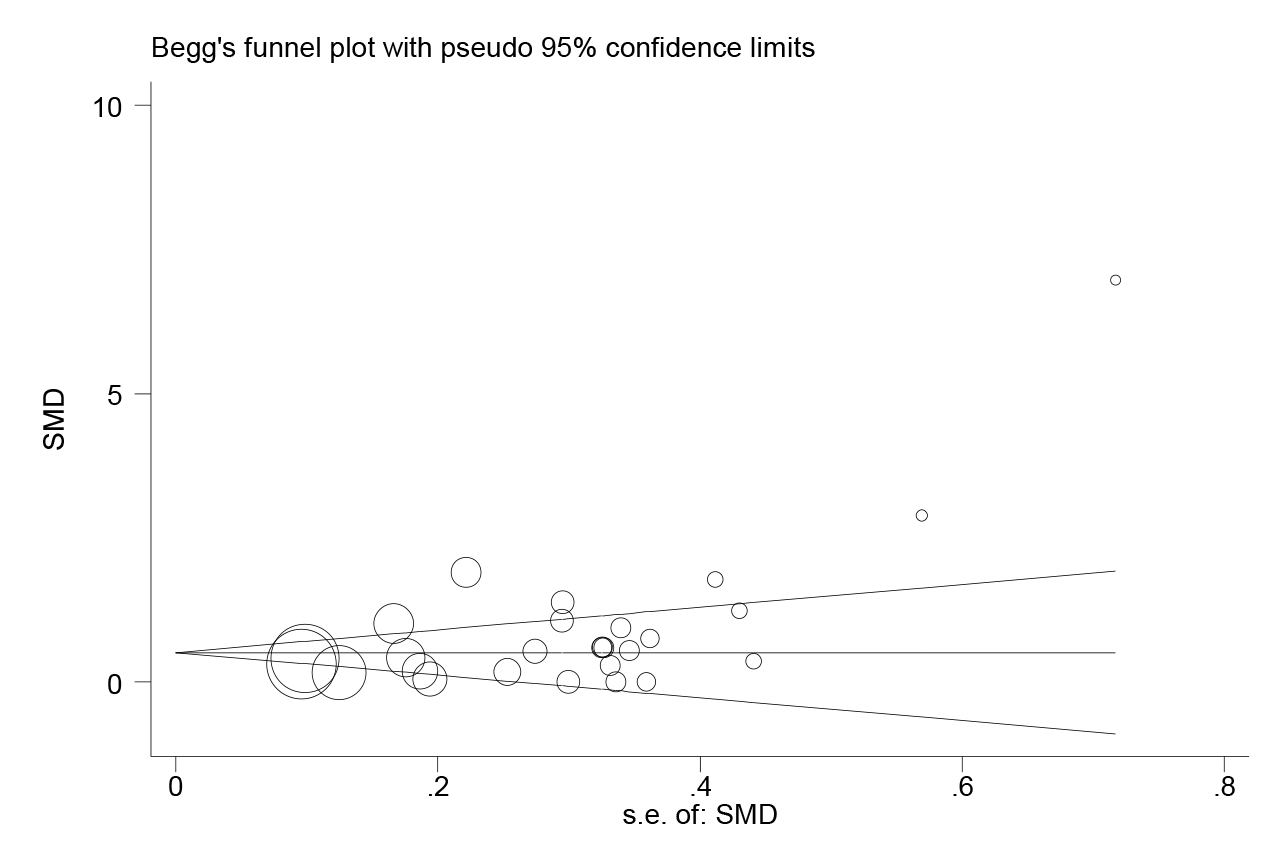
Figure 3: Publication bias for included studies for the comparation between severe and critical groups and non-severe groups in subjects with coronavirus disease 2019.
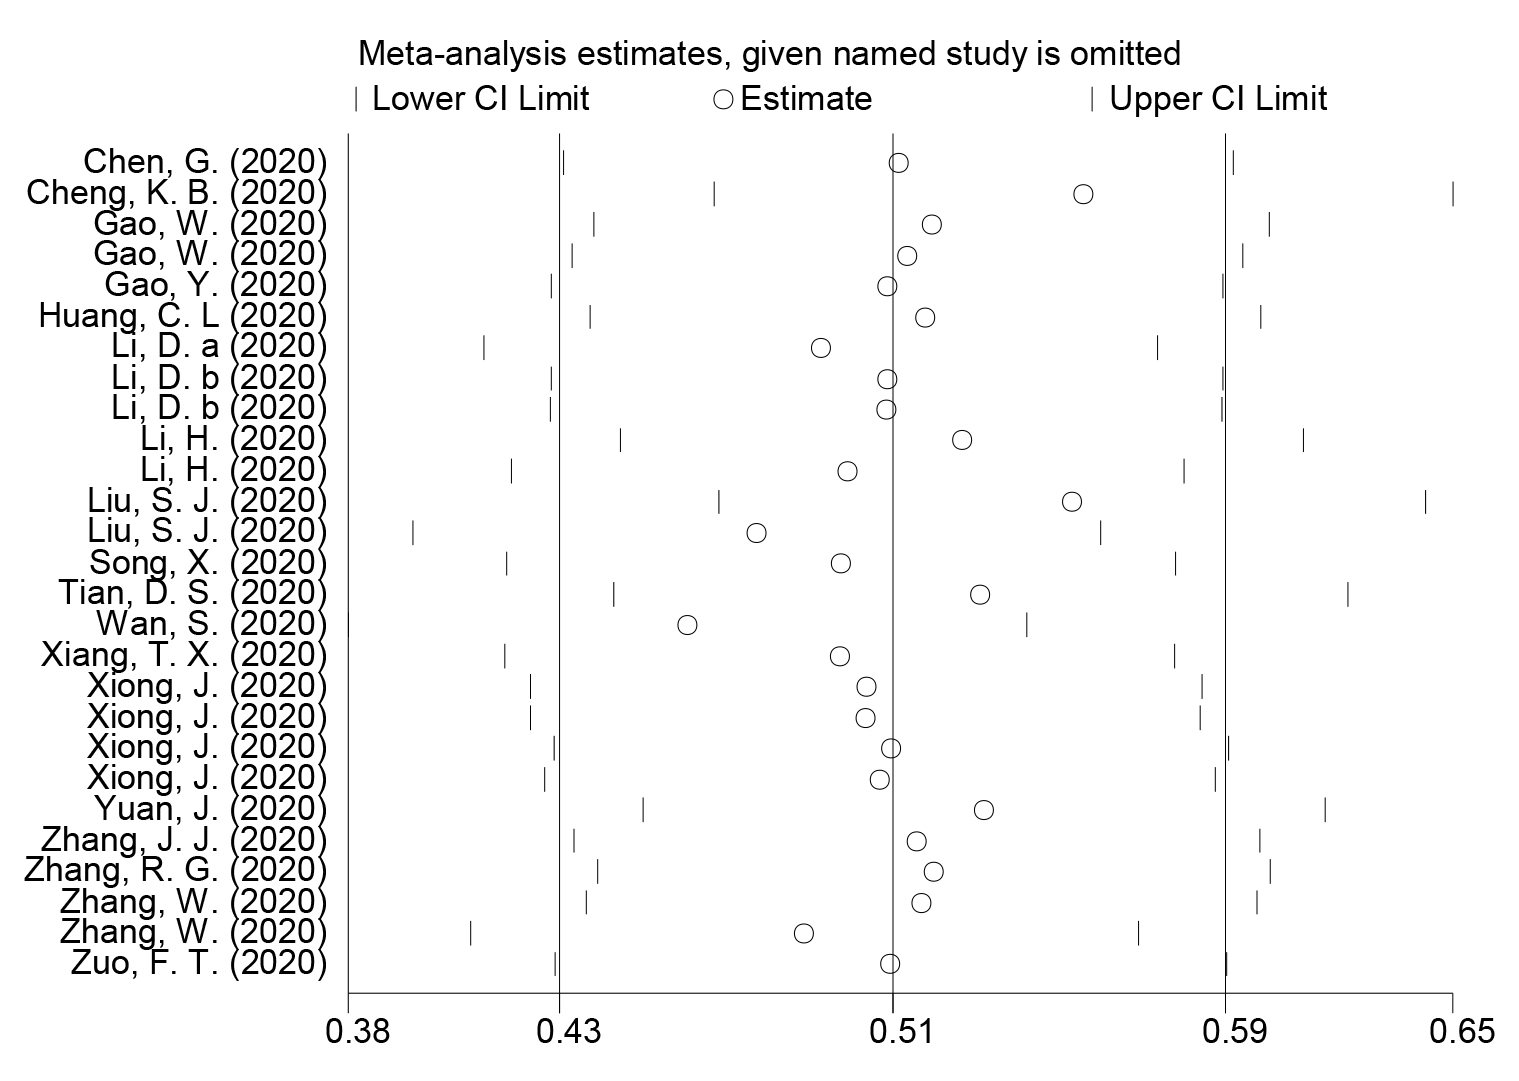
Figure 4: Sensitivity analysis for included studies for the comparation between severe and critical groups and non-severe groups in subjects with coronavirus disease 2019.
Discussion
In the present study, it was indicated that the severe and critical cases of COVID-19 had significantly increased levels of PCT compared with non-sever cases (Figure 2). PCT is usually produced in response to endotoxin or mediators released in response to bacterial infections, and strongly correlates with the extent and severity of bacterial infections [31]. Although not substantially modified in patients with traditional viral infections, increased PCT values were associated with a nearly 5-fold higher risk of severe SARS-CoV-2 infection (OR=4.76) [32]. In a study, the severe cases showed higher proportion of increased PCT (≥0.5 ng/ml) compared with the non-severe cases (13.7% vs. 3.7%) [33]. And in a retrospective cohort study of COVID-19 patients, the non-survivors presented higher PCT levels and higher proportions of increased PCT (≥0.5 ng/ml) as compared to survivors [34].
One of the possible explanation was that the production of PCT is enormously amplified on the condition of viral sepsis caused by SARS-CoV-2 infection [35]. SARS-CoV-2 can directly target the tissues or organs with high expression of Angiotensin-Converting Enzyme 2 (ACE2), including lungs, heart and gastrointestinal tract [36]. Pathological results suggested that bacteria and fungus was negative in 76% sepsis patients with COVID-19 [34]. However, alveolar macrophages or epithelial cells in lung, along with the other tissues and organs attacked by disseminated SARS-CoV-2, generated a crowd of proinflammatory cytokines and chemokines, which is known as systemic cytokine storm [35]. Therefore, increasing evidence indicated that some cases of which followed by multiple systems damage, thus developed into a systemic disease, although the patients with SARS-CoV-2 infection were primarily manifested respiratory tract infection [37–39]. The pathogenesis and dysfunction caused by the systemic cytokine storm resulted in viral sepsis [35]. The PCT levels were dramatically increased in response to the cytokine storm with enhanced concentrations of interleukin (IL)-1β, Tumor Necrosis Factor (TNF)-α and IL-6, granulocyte-colony stimulating factor, interferon gamma induced protein-10, and macrophage inflammatory proteins 1-α [19, 31], most of which were witnessed significantly increased in severe and critical cases of COVID-19 [10, 34, 40]. On the other hand, the synthesis of PCT was inhibited by interferon-γ (INF-γ), whose concentration increased during viral infections [31]. Thus, the values of PCT would remain in normal in patients without complicated bacterial infection or viral sepsis, which is common in mild and moderate cases of COVID-19 [11, 20]. Therefore, significant elevated PCT values might be associated with severe or critical cases characterized by systemic cytokine storm or viral sepsis.
The other possible explanations included the uses of corticosteroids and high overall percentages of comorbidity in severe or critical patients with COVID-19. Corticosteroid treatment in sever SARS-CoV-2 infection were commonly used in clinical practices [41, 42], although its benefits were controversial [43]. And a meta-analysis indicated that corticosteroid use was associated with higher rate of bacterial infection (pooled RR=2.08) [44]. Moreover, increased PCT levels were observed in severe shock, Systemic Inflammatory Response Syndrome (SIRS), and Multiple Organ Dysfunction Syndrome (MODS) [45–47], all of which occurred more common in sever or critical cases of SARS-CoV-2 infection [33, 39].
There were several limitations in the present meta-analysis. First, strong heterogeneity was observed (Figure 2). One of the possible explanations was that the blood levels of PCT fluctuate and had wide ranges of reference interval. Second, interpretation of the results might be limited, as all the included subjects were Chinese, and 10 studies of which came from Wuhan, the most seriously affected area attacked by SARS-CoV-2 infection.
Conclusion
To the best of our knowledge, this was the largest meta-analysis on the association of PCT and the severity of COVID-19. The results from our data indicated that the severe and critical cases had significantly elevated PCT levels compared with non-severe cases. The results also suggested the surged PCT values might be associated with the severity of COVID-19 and its deterioration. Far more studies are needed to draw a more comprehensive conclusion, especially for other countries and ethnicities.
Funding
This study was funded by the Mianyang Science & Technology Project of Emergency Scientific Research for Novel Coronavirus–Infected Pneumonia Pandemic (Grant No. 2020YJKY002).
References
- Velavan TP, Meyer CG (2020) The COVID-19 epidemic. Trop Med Int Health 25: 278–280. [View]
- Cucinotta D, Vanelli M (2020) WHO Declares COVID-19 a Pandemic. Acta Biomed 91: 157–160. [View]
- Meo SA, Alhowikan AM, Al-Khlaiwi T, Meo IM, Halepoto DM, Iqbal M, Usmani AM, Hajjar W, Ahmed N (2020) Novel coronavirus 2019-nCoV: prevalence, biological and clinical characteristics comparison with SARS-CoV and MERS-CoV. Eur Rev Med Pharmacol Sci 24: 2012–2019. [View]
- Zheng J (2020) SARS-CoV-2: an Emerging Coronavirus that Causes a Global Threat. Int J Biol Sci 2020, 16: 1678–1685. [View]
- Wu Z, McGoogan JM (2020) Characteristics of and Important Lessons From the Coronavirus Disease 2019 (COVID-19) Outbreak in China: Summary of a Report of 72314 Cases From the Chinese Center for Disease Control and Prevention. Jama 323:1239–1242. [View]
- Han H, Xie L, Liu R, Yang J, Liu F, Wu K, Chen L, Hou W, Feng Y, Zhu C (2020) Analysis of heart injury laboratory parameters in 273 COVID-19 patients in one hospital in Wuhan, China. J Med Virol 92: 819–823. [View]
- Hamade B, Huang DT (2020) Procalcitonin,Where Are We Now? Critical Care Clinics 36: 23–40. [View]
- Gregoriano C, Heilmann E, Molitor A, Schuetz P (2020) Role of procalcitonin use in the management of sepsis. Journal of thoracic disease 12: S5-S15. [View]
- Aliu-Bejta A, Atelj A, Kurshumliu M, Dreshaj S, Barši? B (2020) Presepsin values as markers of severity of sepsis. International Journal of Infectious Diseases 2020, 95: 1–7. [View]
- Cheng KB, Wei M, Shen H, Wu CM, Chen DC, Xiong WN, Zhou X, Zhang DY, Zheng JH (2020) Clinical characteristics of 463 patients with common and severe type coronavirus disease. Shanghai Medical Journal 1–15. [View]
- Li D, Wang M, L., He B, Xu Y, Zhou XY, Li WJ, Lu WF, Wang J (2020) Laboratory test analysis of sixty-two COVID-19 patients. Medical Journal of Wuhan University 2020: 1–5. [View]
- Xiong J, Jiang WL, Zhou Q, Hu XQ, Liu CY (2020) Clinical characteristics, treatment, and prognosis in 89 cases of COVID-2019. Medical Journal of Wuhan University 2020:1–5. [View]
- Wan S, Xiang Y, Fang W, Zheng Y, Li B, Hu Y, Lang C, Huang D, Sun Q, Xiong Y et al (2020) Clinical features and treatment of COVID-19 patients in northeast Chongqing. J Med Virol 92: 797–806. [View]
- Chen G, Wu D, Guo W, Cao Y, Huang D, Wang H, Wang T, Zhang X, Chen H, Yu H et al (2020) Clinical and immunologic features in severe and moderate Coronavirus Disease 2019. The Journal of clinical investigation 130: 2620–2629. [View]
- Gao W, Yang X, Zheng XQ, Su X, Dou AH, Hui W, Liu M, Xu B (2020) Clinical characteristic of 90 patients with COVID-19 hospitalized in a Grade-A hospital in Beijing. Academic Journal of Chinese PLA Medical School 2020: 1–4. [View]
- WHO (2020) Guidelines for diagnosis and management of COVID-19. Infectious Disease Information, 33: 1–6+26. [View]
- Chen X-M, Shen H-J, Chen X-Q, Li G-X, Ren D-W, et al. (2020) Epidemiologic and Clinical Characteristics of 91 Hospitalized Patients with COVID-19 in Zhejiang, China: A retrospective, multi-centre case series. QJM 113: 474–481.. [View]
- Gao Y, Li T, Han M, Li X, Wu D, Xu Y, et al. (2020) Diagnostic Utility of Clinical Laboratory Data Determinations for Patients with the Severe COVID-19. J Med Virol 92: 791–796. [View]
- Huang C, Wang Y, Li X, Ren L, Zhao J, et al. (2020) Clinical features of patients infected with 2019 novel coronavirus in Wuhan, China. The Lancet 395: 497–506. [View]
- Li D, Long YT, Huang P, Guo WL, Wu SH, et al. (2020) [Clinical characteristics of 80 patients with COVID-19 in Zhuzhou City]. Chinese Journal of Infection Control 1–7. [View]
- Li H, Xiang X, Ren H, Xu L, Zhao L, et al. (2020) SAA is a biomarker to distinguish the severity and prognosis of Coronavirus Disease 2019 (COVID-19). J Infect 80: 646–655. [View]
- Liu SJ, Cheng F, Yang XY, He J, Li H, et al. (2020) [A study of laboratory confirmed cases between laboratory indexesand clinical classification of 342 cases withCorona Virus Disease 2019 in Ezhou]. Laboratory Medicine 1–12.
- Song X, Chen T, Sun JJ, Chen M, Liu WY, et al. (2020) The clinical value of combined detection of PCT and IL-6 in patients with COVID-19]. International Journal of Laboratory Medicine 2020:1–8.
- Tian D-S, Wang W, Shang K, Ma K, Xie C, et al. (2020) Dysregulation of immune response in patients with COVID-19 in Wuhan, China. Clin Infect Dis 71: 762–768. [View]
- Xiang TX, Liu JM, Xu F, Cheng N, Liu Y, et al. (2020) Analysis of clinical characteristics of 49 patients with coronavirus disease 2019 in Jiangxi]. Chinese Journal of Respiratory and Critical Care Medicine 19: 154–160.
- Yuan J, Sun YY, Zuo YJ, Chen TY, Cao Q, et al. (2020) [Clinical characteristics of 223 patients with COVID-19 in Chongqing]. Journal of Southwest University (Natural Science Edition) 2020:1–7.
- Zhang J-j, Dong X, Cao Y-y, Yuan Y-d, Yang Y-b, et al. (2020) Clinical characteristics of 140 patients infected with SARS?CoV?2 in Wuhan, China. Allergy 75: 1730–1741. [View]
- Zhang R, Wen L, Li Q, Yang B, Wang Z (2020) Clinical Features of 69 Cases with Coronavirus Disease 2019 in Wuhan, China. Clinical Infectious Diseases 2020. [View]
- Zhang W, Hou W, Li TZ, Li AX, Pan W, Jin RH, Liang LC, Hu ZJ (2020) Clinical characteristics of 74 hospitalized patients with COVID-19. Journal of Capital Medical University 2020:1–7. [View]
- Zuo FT, Li CL, Dong ZG, Chang XH, Jia MY, Wei C, Zheng XS (2020) Analysis of the correlation between clinical characteristics and disease severity in patients with novel coronavirus pneumonia. Tianjin Medical Journal 2020:1–6. [View]
- Schuetz P, Albrich W, Mueller B (2011) Procalcitonin for diagnosis of infection and guide to antibiotic decisions: past, present and future. BMC medicine 9:107. [View]
- Lippi G, Plebani M (2020) Procalcitonin in patients with severe coronavirus disease 2019 (COVID-19): A meta-analysis. Clinica chimica acta; international journal of clinical chemistry 505: 190–191. [View]
- Guan WJ, Ni ZY, Hu Y, Liang WH, Ou CQ (2020) Clinical Characteristics of Coronavirus Disease 2019 in China. The New England journal of medicine 2020. [View]
- Zhou F, Yu T, Du R, Fan G, Liu Y, et al (2020) Clinical course and risk factors for mortality of adult inpatients with COVID-19 in Wuhan, China: a retrospective cohort study. The Lancet 2020. [View]
- Li H, Liu L, Zhang D, Xu J, Dai H, Tang N, Su X, Cao B (2020) SARS-CoV-2 and viral sepsis: observations and hypotheses. The Lancet 395: 1517–1520. [View]
- Terpos E, Ntanasis-Stathopoulos I, Elalamy I, Kastritis E, Sergentanis TN, et al (2020) Hematological findings and complications of COVID-19. American Journal of Hematology 95: 834–847. [View]
- Driggin E, Madhavan MV, Bikdeli B, Chuich T, Laracy J, et al (2020) Cardiovascular Considerations for Patients, Health Care Workers, and Health Systems During the Coronavirus Disease 2019 (COVID-19) Pandemic. Journal of the American College of Cardiology 75: 2352–2371. [View]
- Bangash MN, Patel J, Parekh D (2020) COVID-19 and the liver: little cause for concern. The Lancet Gastroenterology & Hepatology 2020. [View]
- Fu L, Wang B, Yuan T, Chen X, Ao Y, Fitzpatrick T, Li P, Zhou Y, Lin Y, Duan Q et al (2020) Clinical characteristics of coronavirus disease 2019 (COVID-19) in China: a systematic review and meta-analysis. J Infect 80: 656–665. [View]
- Gharebaghi R, Heidary F, Moradi M, Parvizi M (2020) Metronidazole; a Potential Novel Addition to the COVID-19 Treatment Regimen. Arch Acad Emerg Med 8: e40. [View]
- Zhou W, Liu Y, Tian D, Wang C, Wang S, Cheng J, Hu M, Fang M, Gao Y (2020) Potential benefits of precise corticosteroids therapy for severe 2019-nCoV pneumonia. Signal Transduction and Targeted Therapy 5: 18. [View]
- Shang L, Zhao J, Hu Y, Du R, Cao B (2020) On the use of corticosteroids for 2019-nCoV pneumonia. The Lancet 395: 683–684. [View]
- Russell CD, Millar JE, Baillie JK (2020) Clinical evidence does not support corticosteroid treatment for 2019-nCoV lung injury. The Lancet 395: 473–475. [View]
- Yang Z, Liu J, Zhou Y, Zhao X, Zhao Q, Liu J (2020) The effect of corticosteroid treatment on patients with coronavirus infection: a systematic review and meta-analysis. Journal of Infection 81: e13-e20. [View]
- Choi J, Stumpf A, Brandstetter T, Hübner J, Rühe J (2019) Hydrogel based protein biochip for parallel detection of biomarkers for diagnosis of a Systemic Inflammatory Response Syndrome (SIRS) in human serum. PloS one 14: e0225525. [View]
- Hui L, Zhang X, An X, Li J, Zang K, Shang F, Zhang C, Zhang G (2017) Higher serum procalcitonin and IL-6 levels predict worse diagnosis for acute respiratory distress syndrome patients with multiple organ dysfunction. Int J Clin Exp Pathol 10: 7401–7407. [View]
- Tong HS, Liu YS, Wen Q, Tang YQ, Yuan FF, Su L (2012) Serum procalcitonin predicting mortality in exertional heatstroke. Emerg Med J 29: 113–117. [View]