- 4192 Devonwood Way, Ashburn, Virginia, 20148
- Helpline: +1 (703) 665-3747
Aortic Stenosis Doppler Discrepancies
- Home
- Back to Journal
- Article Details
Introduction
Aortic Stenosis (AS) in the pediatric population can be a serious and hemodynamically significant lesion, which requires frequent monitoring and evaluation. It has a mean incidence rate of 401 per million live births [1] and presentation varies widely. When the disease becomes hemodynamically significant, an invasive intervention may be indicated. Previously, catheterization data was the standard for assessment of disease severity and subsequent interventions. Doppler echocardiography has now replaced catheterization for both the initial evaluation of disease severity as well an important tool for long term monitoring. There have been numerous publications concerning the poor correlation between gradients measured by echocardiography and cardiac catheterization [2–6]. These discrepancies have been attributed to the technical limitations of transthoracic ultrasound Doppler and the discrepancy between Doppler derived peak instantaneous and catheter derived peak-to-peak measurements. Thus, the findings on echocardiogram may not reliably predict the gradient measured at catheterization.
Based on guidelines published by Lopez et al. for pediatric echocardiography, left ventricular outflow tract instantaneous and mean gradients are best measured in the apical 3-chamber, suprasternal long-axis, or the Suprasternal Notch (SSN) view [5]. Current guidelines recommend using the highest peak gradient identified. Recommendations also include using continuous-wave Doppler interrogation and the cleanest high velocity spectral Doppler envelope used for interpretation [5]. Although previous studies have indicated discrepancy in echocardiographic measurements and gradients measured at catheterization, there have not been any studies in the pediatric population assessing the correlations of gradients obtained by echocardiography from various views for the same patient within the same study. If the measurements from the two views within the same patient were discrepant, it would be important to know which view was used not just for referral for possible intervention, but also for long term monitoring. The purpose of this study is to assess and compare measurements obtained from the Suprasternal Notch view (SSN) and Apical View (Ap) for a patient within the same study.
Materials and Methods
The echocardiography database at Children’s Hospital of Los Angeles was interrogated retrospectively to find patients with a diagnosis of AS from January 1, 2012 to May 22, 2016. Institutional IRB approval was obtained. We excluded AS patients who had surgical aortic valve intervention, those with supravalvar or subvalvar stenosis, and individuals with aortic valve peak Doppler velocity < 2 m/s7. Individuals who had aortic valvuloplasty were included as long as they did not meet exclusion criteria. If there were multiple studies per patient within this time period, we used the earliest echocardiogram per patient that met inclusion criteria, thus each patient was only included once (Figure 1, Figure 2). A cohort of normal patients having echocardiograms performed in our laboratory during the same time period was also established (Figure 3, Figure 4). Such patients included those referred for murmurs, pre-chemotherapy evaluations, and sickle cell anemia for example. Data collections included recordings of maximum velocity, mean velocity, and estimated pressure gradients from both the suprasternal notch and apical views on the same day for the same patient. Our echocardiography lab standard is to obtain measurements that are as parallel as possible to the peak velocities. Some reports did not include aforementioned values but were reviewed by a primary investigator (GK) and obtained if able. If the missing values could not be obtained, the study was excluded. Measurements were re-examined by a single investigator (GK) to assess for completeness and accuracy. The primary investigators were not blinded to the study results.
Data is represented by medians (interquartile ranges). Linear regression analysis was used to determine relationship between velocities. Bland-Altman analysis was used for technique comparison. A P-value < 0.05 was considered statistically significant. Data was analyzed with JMP Pro v. 12.1.
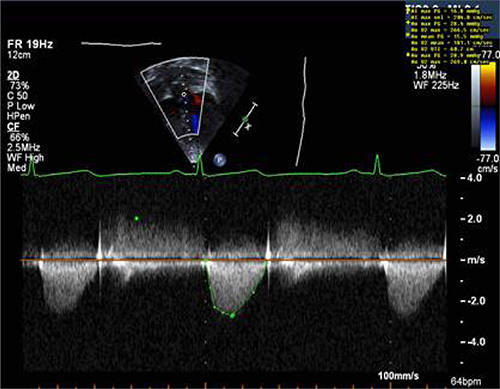
Figure 1: Sample of Doppler image and measurements obtained from apical window in a patient with aortic stenosis.
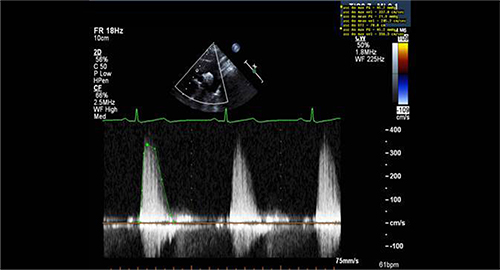
Figure 2: Sample of Doppler image and measurements obtained from suprasternal window in a patient with aortic stenosis.
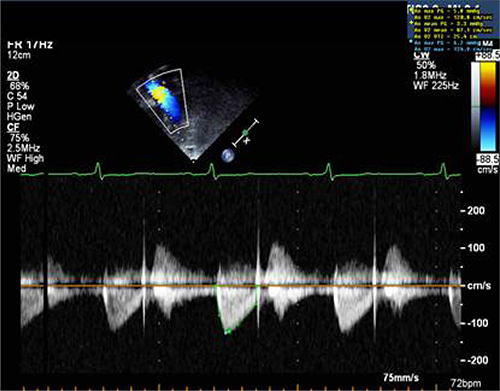
Figure 3: Sample of Doppler image and measurements obtained from apical window in a control patient.
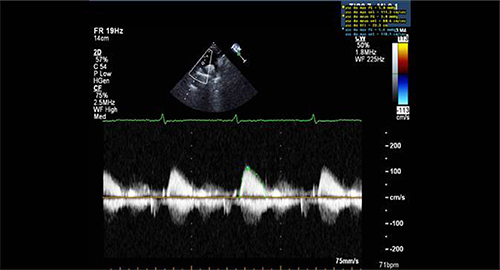
Figure 4: Sample of Doppler image and measurements obtained from suprasternal window in a control patient.
Results
There were 81 patients with AS identified that met inclusion criteria and 97 normal subjects with normal echocardiograms. Demographics of the study population are shown in table 1. As noted in previous studies, there were more males than females in the AS group. There was a significant difference between group demographics of sex, age, and body mass index.
Table 1: This table lists the demographics of the Aortic Stenosis (AS) and normal control groups. There was a higher proportion of male subjects in the AS group compared to the normal control group. Further, the AS group was older and thus had a higher BMI than the normal control group.
|
|
AS group |
Normal group |
P-value |
|
Number of patients |
81 |
97 |
– |
|
Male |
59 (73%) |
53 (55%) |
0.01 |
|
Age in years (quartile range) |
10 (3,15) |
5 (0.4,11) |
0.008 |
|
Body Mass index |
1.01 (0.32,1.3) |
0.98 (0.64,1.6) |
0.003 |
For AS subjects, continuous wave Doppler was noted to have been used in both the SSN and Ap windows due to the higher velocities and issues with aliasing. For normal subjects, continuous wave Doppler was also used in the majority of SSN windows (88/97) and Ap windows (89/97).
In both the AS group and normal subjects, the Ap view max velocity and max gradient were lower than the SSN view. There was no difference between the two views when comparing the mean gradients (table 2). Maximum SSN velocities were systematically higher in 67.9% (55/81) of AS patients and 67.0% (65/97) of healthy patients (P=0.21). The maximum velocity in the Ap view is systematically lower compared to the SSN view in both the AS group and normal subjects with P-values of 0.017 and 0.0001 respectively (Figure 5). In both groups, the magnitude of the discrepancy increased as maximum SSN velocity increased (P<0.001, Figure 6). However, the variation about the regression line was greater in the AS group (P=0.002).
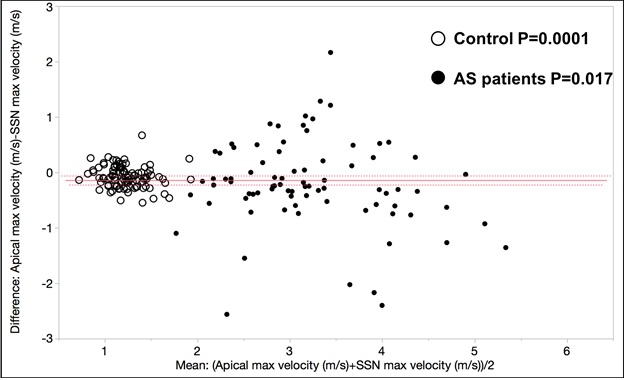
Figure 5: This figure demonstrates that the LVOT/aortic valve velocity is systematically lower when measured in the apical four-chamber vs the suprasternal notch view. This is true for both control subjects and patients with aortic valve stenosis. Individual group P=values for Bland-Altman matched analysis are provided.
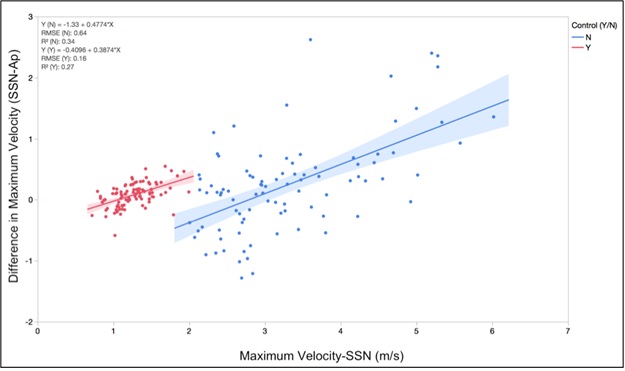
Figure 6: The magnitude of the difference between apical and suprasternal notch views increases as the maximum velocity (severity of AS) increases.
Table 2: These tables demonstrates the median and interquartile range for max velocity (m/s), max gradient (mmHg) and mean gradient (mmHg) in the suprasternal notch view (SSN) and apical view (Ap) for both the aortic stenosis (AS) group and the normal control group. Paired analysis was performed using Wilcoxon signed-rank test.
|
|
AS group |
Normal group |
||||
|
|
SSN |
Ap |
P-value |
SSN |
Ap |
P-value |
|
Max Velocity (m/s) |
3.2 (2.7,3.8) |
3.1 (2.6, 3.7) |
0.01 |
1.3 (1.1,1.4) |
1.2 (1.0,1.3) |
<0.0001 |
|
Max Gradient (mmHg) |
39.8 (28.4,57.4) |
37.5 (27.4,55.9) |
0.02 |
6.3 (4.8,8.2) |
5.7 (4.4,6.8) |
<0.0001 |
|
Mean Gradient (mmHg) |
19.0 (12.0,29.9) |
19.6 (14.8,1.1) |
0.88 |
2.9 (2.2,4.0) |
3.1 (2.2,3.7) |
0.88 |
Discussion
Pediatric aortic stenosis is a chronic disease that requires lifelong monitoring and repeated evaluation. Our aim is to evaluate if Ap and SSN velocity/gradient differences occur in pediatric patients with AS and normal control subjects. We found that max velocity measured using continuous wave spectral Doppler in the Ap view is lower than the max velocity measured in the SSN view. Although the average absolute difference between the two windows is not large (0.1m/s), this is an average of our patients and within each patient there can be variation. This variation is more notable at higher velocities. This is consistent with previous published data in adults with aortic stenosis although there is limited published data in children. Previous studies recommend obtaining maximum as well as mean velocities and gradients from at least two different windows and to document the highest values5 but without comment on the correlation or any differences in the quantitative measurements. There is adult data to suggest that higher gradients are often obtained from nonapical imaging windows, confirming the importance of obtaining measurements from multiple windows [8–10]. Systematic differences in the technique are important to identify for accurate prognosis and long term follow up because velocity and pressure gradients determine the severity of disease and guide referral for surgical intervention. Additionally, these systematic differences highlight the importance of noting which windows yielded the measurements used in echocardiogram reports. Consistency in the measurement and reporting process will be essential while collecting data on patients.
Vlahos and colleagues published a thorough review of echocardiographic derived Doppler measurements from both apical and high parasternal/suprasternal notch views in pediatric patients with aortic stenosis [6] and they proposed that an average of the two maximum Doppler values (apical and high) was the best predictor of catheter based aortic valve gradient. While the primary goal of these studies was not to compare intra-study obtained values, they found that each view had limitations when predicting catheter-based measurements. Another important finding in their study was that the ascending aorta size improved the prediction of the catheter-based measurement from an R2 of 0.5 to an R2 of 0.58. This suggests that other anatomic geometries are important for prediction of catheter-based measures.
More recently, Thaden and colleagues evaluated Left Ventricular Outflow Tract (LVOT) angle and its impact on the apical and high parasternal/suprasternal notch Doppler measurements [8]. They found a significantly higher velocity in the high parasternal view compared to the apical view when there was a more acute angle of the LVOT. When the LVOT angle was more obtuse, the velocity in the apical view was higher (Figure 7). Our data demonstrated that maximum velocities obtained from the suprasternal notch were systematically higher compared to apical views in both AS and healthy patient groups. The angle of interrogation when comparing the position on the chest wall and the angle at which the LVOT arises from the LV both likely contribute to the differences we see in our data. Growth of children and changes in imaging windows will affect the position of the probe with respect to the chest wall and the position of the LVOT. This is likely why multivariate predictors of catheter based gradient measurements include age and ascending aorta diameter in the work by Vlahos et. Al [6]. This may explain why the difference in maximal velocity, between the apical and suprasternal views, increased at higher velocities (Figure 5).
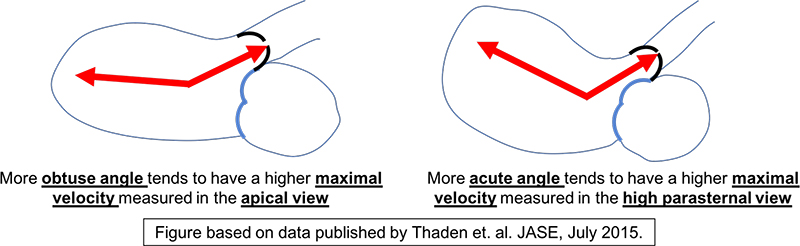
Figure 7: This is a schematic demonstrating the difference in the angle of the LVOT with respect to the LV chamber. Based on work by Thaden and colleagues, the angle of the LVOT was predictive of whether the apical view or the high parasternal view produced the higher maximum velocity.
The morphology of the aortic valve determines the angle at which the vena contracta and the jet arise from the valve with respect to the LVOT and the ascending aorta. Newer methods, including 4D cardiac MRI and 3D echo, have improved our understanding of the aortic flow profiles in patients with bicuspid aortic valve, both stenotic and non-stenotic variants. This angle plays a significant role in data acquisition when Doppler echocardiography is used in the clinical setting. An angle of 30° can cause a 15% decrease in measured velocity [8]. Therefore, in our patients, the wider degree of discrepancy in maximal velocity at increasing stenosis severity may be explained by the angle at which the jet arises from the valve, the angle of the valve with respect to the LV chamber, and the position of the probe on the chest. This could be a potential future direction of investigation.
The current pediatric echo guidelines for aortic valve Doppler interrogation encourage the use of both apical and high parasternal or suprasternal notch views, and predicting catheter based gradients in pediatric patients depends on both apical and high parasternal and suprasternal notch views. Therefore, knowing that the magnitude of the difference between maximum velocity measurements in the suprasternal notch vs apical view will increase with the severity is important when longitudinally assessing valvar aortic stenosis in the pediatric population. Expanding the standard echocardiogram lab techniques to report both SSN and Ap information should be a new standard in order to present accurate and consistent information.
Our study had several limitations. Retrospective data collection is a limitation and we do not enough information regarding aortic valve morphology to further evaluate if this played a role in our findings. Individuals with atrial or ventricular level shunts were not excluded from this study however, we were specifically looking at intra-study comparisons and not direct comparison to catheterization data. Data was also collected by different sonographers, which could influence technique and precision. “Feathering” of the Doppler envelope in reviewed images is an area for measurement bias, although this error would be consistent as all studies were re-reviewed by a single observer (GK). Reproducibility was unable to be evaluated given that this is a retrospective study. Finally, not all of our patients had a higher SSN maximum velocity when comparing to apical views and this will require additional investigation in order to determine the cause of this finding and if this relates to the LVOT angle, aortic valve morphology, and eccentricity of flow jet.
Conclusion
Maximum Doppler velocities obtained from the suprasternal notch views were systematically higher in both pediatric control and aortic stenosis patients. Furthermore, the magnitude of that difference increased at higher velocities. This finding contributes to our assessment and long term follow up of pediatric patients with valvar aortic stenosis and signifies the importance of noting where measurements were taken.
References
- Hoffman JI, Kaplan S (2002) The incidence of congenital heart disease. J Am Coll Cardiol 39: 1890–1900. [View]
- Barker PC, Ensing G, Ludomirsky A, Bradley DJ, Lloyd TR, (2002) Comparison of simultaneous invasive and noninvasive measurements of pressure gradients in congenital aortic valve stenosis. J Am Soc Echocardiogr 15: 1496–1502. [View]
- Baumgartner H, Stefenelli T, Niederberger J, Schima H, Maurer G (1999) Overestimation” of catheter gradients by Doppler ultrasound in patients with aortic stenosis: a predictable manifestation of pressure recovery. J Am Coll Cardiol 33: 1655–1661. [View]
- Cantinotti M, Giordano R, Emdin M, Assanta N, Crocetti M, Marotta M, et al. (2017) Echocardiographic assessment of pediatric semilunar valve disease. Echocardiography 34: 1360–1370. [View]
- Lopez L, Colan SD, Frommelt PC, Ensing GJ, Kendall K, Younoszai AK, et al. (2010) Recommendations for quantification methods during the performance of a pediatric echocardiogram: a report from the Pediatric Measurements Writing Group of the American Society of Echocardiography Pediatric and Congenital Heart Disease Council. J Am Soc Echocardiogr 23: 465–495. [View]
- Vlahos AP, Marx GR, Mcelhinney D, Oneill S, Goudevenos I, Colan SD (2008) Clinical utility of Doppler echocardiography in assessing aortic stenosis severity and predicting need for intervention in children. Pediatr Cardiol 29: 507–514. [View]
- Kitchiner DJ, Jackson M, Walsh K, Peart I, Arnold R (1993) Incidence and prognosis of congenital aortic valve stenosis in Liverpool (1960–1990). Br Heart J 69: 71–79. [View]
- Thaden JJ, Nkomo VT, Lee KJ, Oh JK (2015) Doppler Imaging in Aortic Stenosis: The Importance of the Nonapical Imaging Windows to Determine Severity in a Contemporary Cohort. J Am Soc Echocardiogr 28: 780–785. [View]
- Stamm RB, Martin RP (1983) Quantification of pressure gradients across stenotic valves by Doppler ultrasound. J Am Coll Cardiol 2: 707–718. [View]
- Williams GA, Labovitz AJ, Nelson JG, Kennedy HL (1985) Value of multiple echocardiographic views in the evaluation of aortic stenosis in adults by continuous-wave Doppler. Am J Cardiol 55: 445–449. [View]